If you use a tool like Roam Research, Obsidian, or Logseq, you’ve likely seen the knowledge graph:
Graphs Gonna Grow
As you add notes to your database, the graph grows. Each note becomes a node. Each link becomes a line connecting one node to another.
A graph consisting of just a few nodes and lines is easy to navigate. But as more nodes are added and more connections are made, the graph becomes increasingly complex.
The impact of this on the user varies, depending on the user’s tool of choice.
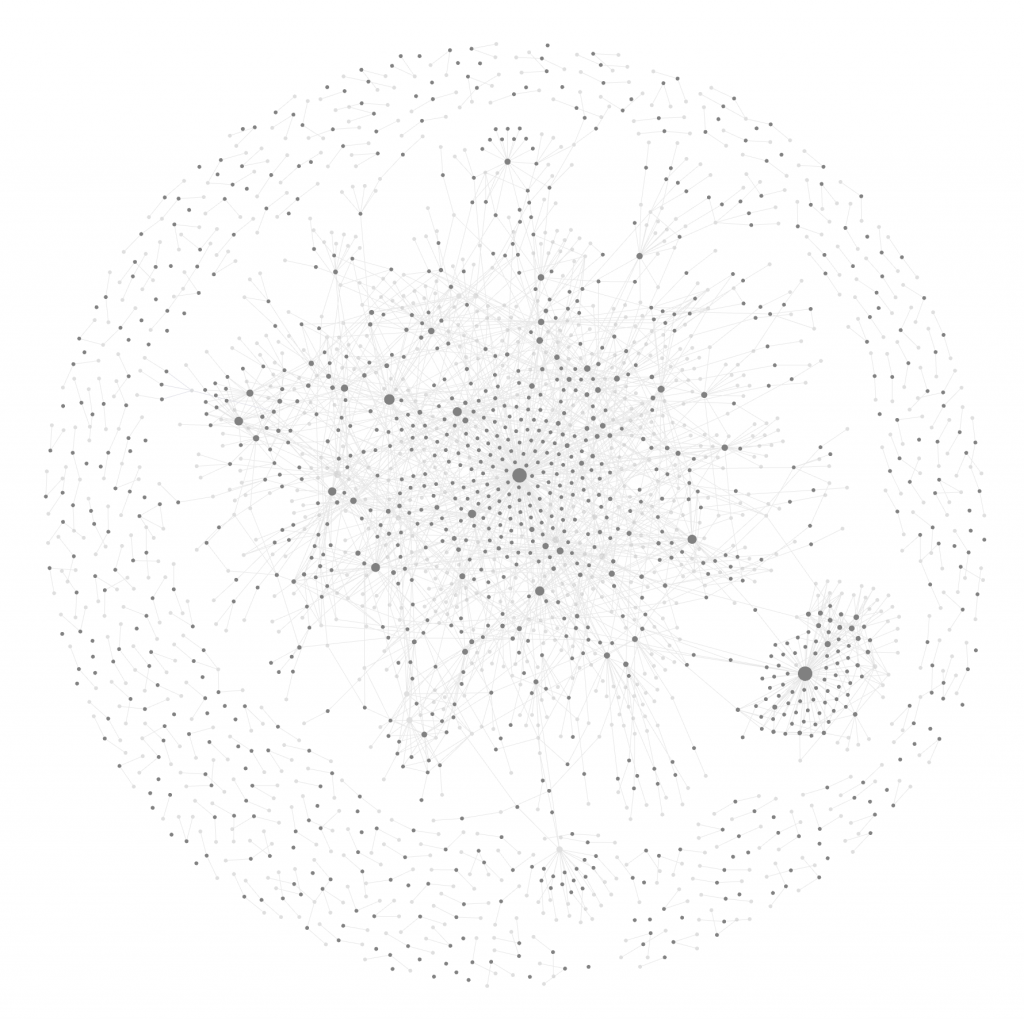
Obsidian provides users with a very nice time lapse of how their graph grows over time: a pulsing, expanding visual that reminds me of how a single-celled organism might divide subdivide as it evolves toward greater complexity. Even with hundreds or thousands of notes, Obsidian’s graph remains easy to navigate at many different scales.
By contrast, the graph in Roam Research quickly becomes a wall of undifferentiated grey confusion:
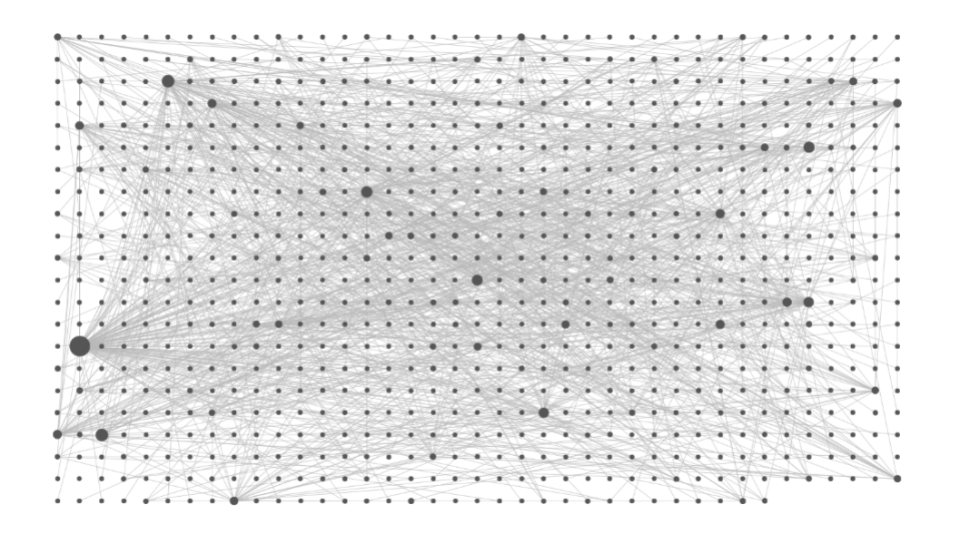
(This is, in fact, one reason I prefer Obsidian to Roam.)
Haters Gonna Hate
As I’m writing this, crusty contrarians have latched onto the issue of the graph’s creeping complexity as one of their arguments against using tools for thought. They say:
- Graphs are too complex and unstructured to be useful tools.
- Graphs emulate the mind, making them too jumbled and scattered to be useful.
- Graphs are all about bragging rights for nerds (“My graph’s bigger than your graph.”)
- Graphs represent a departure from the linear, structured outlines on which 99% of all great output is based, making them unsuitable for use by those who are serious about contributing to knowledge.
(That last point strikes me as the most ridiculous. Since 99% of all human correspondence used to be written by hand, should be eschew email? Since 99% of all published work used to be created by hand, should we refuse to use typewriters or word processors?)
All of these assertions, though, strike me as fundamentally misunderstanding the nature and power of the knowledge graph.
Emergent Structure over Hierarchal Structure
The notion that the knowledge graph is an unstructured jumble is simply false.
Every time we link or tag notes, we impose structure on the graph. That structure isn’t linear — that is, it does not take the form of a rigid outline with indentations and Roman numerals. Nor is it hierarchal, with files stuffed into nested folders.
But the structure is there! The knowledge graph just represents a different kind of structure: emergent structure. This type of organization, rather than being an expression of our intention, arises as an expression of our attention. Instead of outlines and filing systems, which force us to define in advance how material should be organized, an emergent structure says, “Let’s just work, watch, and see what ideas concern us most over time.”
Instead of an edict, an emergent structure is a leap of faith.
(Nature, by the way, loves emergent structure. Ants work without blueprints. No “Chief Ant” calls the shots. But over time, as the ants experiment with solutions to the problems they encounter, astounding and effective structures arise.)
While the grasshoppers of doubt dance and fiddle, we ants are busy admiring the exquisite interplay of linear and non-linear thinking … and reaping the rewards of working in a way that incorporates both.
Of Outlines and Mind Maps
An outline’s value lies in its ability to order, structure, and organize information. Indentation defines dependency. Numbers and letters define sequence. Once the outline defines an organizational scheme, ew information must either be pressed into that scheme … or the outline must be revised to accommodate it. (Both of those efforts, by the way, create significant friction.)
A mind map’s value, by contrast, lies in its spontaneity and flexibility. Relationships are shown by proximity and connection. This idea goes here. This idea goes there. Hey! They’re connected! Pull them together. Hey! This idea doesn’t fit? Drag it away. The shape of the map cannot be known or predicted in advance; instead, it emerges over time.
The knowledge graph has more in common with mind maps than outlines. In fact, the graph is essentially a mind map of our thinking across many different topics, all at once. Ideas with many connections become the hubs of constellations; the greater the number of connections, the larger the hub becomes.
As we shall see, when the time to harvest our ideas arrives, our graph will be more than ready to help us create the outlines that linear thinkers value.
Of Presentations and Brainstorms
Presentations — speeches, lectures, and even scripts, movies, posts, and books — are prepared in advance. Their content is pruned for purpose and audience. What works, is effective, or supports the argument being made is retained; anything superfluous should be stripped away. As the presenter clarifies the goal of the presentation, the content is tweaked accordingly.
This requires a great deal of work behind the scenes, most of which is hidden from the audience prior to delivery.
Brainstorming, by contrast, is “in the moment.” Inhibitions must be shed. Quantity of ideas must be favored over quality (at least initially). Instead of pursuing a solution, a brainstorm pursues all solutions, branching off in all directions at once without concern for staying on topic.
(The time to evaluate and organize ideas will come — and must come! — before the brainstorm’s output can be made useful. But in order to be effective, we must squelch the urge to impose order prematurely.)
The knowledge graph is a visual representation of an ongoing brainstorm: going where the material takes us, pursuing connections forged as much by whimsy as by reason. It is a model of the conversation we are having with ourselves and our ideas. Instead of a presentation being delivered, the graph is a picture of the mental sausage being made. It’s messy! It writhes! And that is how we want it.
As we shall see, when the time comes to package the results for our audience, our graph will show us the way.
Different Methods, Different Purposes, Different Times
Outlines and knowledge graphs aren’t enemies or opposites. Instead, they are different tools serving different purposes, meant to be used at different points in the creative process.
Early in the creative process, even the most ardent linear or structural thinkers begin their work in the messy realm of possibility. A suspicion leads them here. An idea leads them there. As they work, this slippery material begins to condense into little piles. Over time, a pattern emerges.
Eventually, this process generates an outline … and from this, perhaps, some output linear thinkers can share. They do not share the doodles, fleeting ideas, notes, diagrams, highlights, and sticky notes that informed their thinking. They often don’t even hand us their outline. Instead, they pass us the polished product.
The knowledge graph is a digital model of potentials, possibilities, suspicions — the parallel to the doodling, pondering, diagramming, highlighting, and sticky noting a linear thinker engages in before creating an outline. As we add to it, patterns emerge. Hubs and constellations appear: pre-cursors to points we may integrate in our outlines later on.
We would never hand an audience our knowledge graph and say, “Behold!”
But we can — and do! — go spelunking in this cavern of our own creation, questing for insights and inspiration that can later be organized and polished into work worth sharing.
When we want freewheeling, associational, intuitive exploration of many ideas across all the areas that interest us, we turn to our graph. Once we’ve been inspired, we shift to a more linear and critical way of working. When we want reasoned, structured expressions of our ideas, we begin outlining things.
But we don’t want to adopt rigidity too quickly, because a structure imposed too early in the creative process limits where our associations can take us, becoming a prison for thought.
The graph is the “Get out of Jail” free card for the mind.
Practical Applications for The Knowledge Graph
The graph’s non-linear, organic nature makes it a powerful tool for creative appliacations.
Identifying Where Maps of Content are Needed
When I first heard Nick Milo talk about maps of content, or MOC’s, I got very excited. I made a list of all my areas of potential interest. I created a MOC template. I generated MOCs for every area of interest on my list.
Most of these MOCs remained blank, and I eventually deleted them.
Now, I work differently. Over time, I make notes. Over time, as I link and tag and annotate, certain nodes in my graph begin to grow. Around these nodes, constellations of connects emerge.
With a glance at the graph, I can see clusters of thought growing. By mousing over the hub at the center of the largest clusters, I can identify the topics monopolizing my time and attention. When it comes to making MOCs, doesn’t it make sense to start there?
I no longer dutifully stamp out MOCs. Instead, I make notes … and let my graph point me to the subjects deserving of the level of exploration and organization that MOCs provide.
Discovering Unconscious or Unintentional Patterns
I keep a dream journal. In it, I make pretty much every person, action, or object in my dreams — anything that might have symbolic meaning — into a link.
Over time, in my graph, large nodes begin forming around repeated symbols.
In dreams, it turns out, I’m often riding elevators. They always have odd, massive control panels … and they always malfunction or behave in unexpected ways.
Escalators? Stairways? Little parks? Tidy rows of homes? That restaurant on that grassy hill? Many of my dreams, it turns out, take place in a consistent landscape — a city I’ve never visited, but that has a topography that persists across my dreams.
A lanky young man with curly brown hair? He’s turned up in multiple dreams over the years. My dream stalker is always trying to tell me something — though his messages never quite make sense, or make sense too late.
I’d noticed some of these patterns in my dreams before (when feeding my dream journal to DEVONThink, for example). But since I started keeping my dream journal in Obsidian, I’ve spotted many more such patterns … all because the graph made unconscious patterns easier to see.
Defining what Fascinates Us
Where do you spend most of your time? What topics occupy your mind the most? Your graph knows, and, with a glance, can tell you.
What authors are dominating your reading list? What books are shaping your thinking most? Where did an idea originate … and how has your understanding expanded over time? What authors, books, and ideas should you be sharing with your audience?
Your graph knows, and, with a glance, can tell you.
Developing a Presentation
Ready to write a post, create a presentation, record a video, or author a book on a given topic? Consult the graph.
The structured outline you need is lurking there, waiting to be defined. Large nodes hint at core ideas; constellations of concepts suggest chapters. The graph is your map to all your material; all you have to do is follow it … organize it … and start creating.
Let the Graph be the Graph
The graph isn’t in competition with linear, structured thinking! Just the opposite is true: the graph is a precursor to, and even a partner in, the creation of material worth sharing.
Given the chance, the graph’s visual nature can get your ideas out of your head and onto the screen, where you can literally see what you’re thinking. Once it draws your attention to hubs and clusters and patterns of thought, you can use the intelligence gleaned from your map to inform your creative strategy … and make wonderful things to share.
If that’s eye candy … well, bag me up a pound or two. It seems I have a sweet tooth.
This post is better than my video on the same subject … but if you prefer video, here it is: